Skeleton loading for dashboard charts
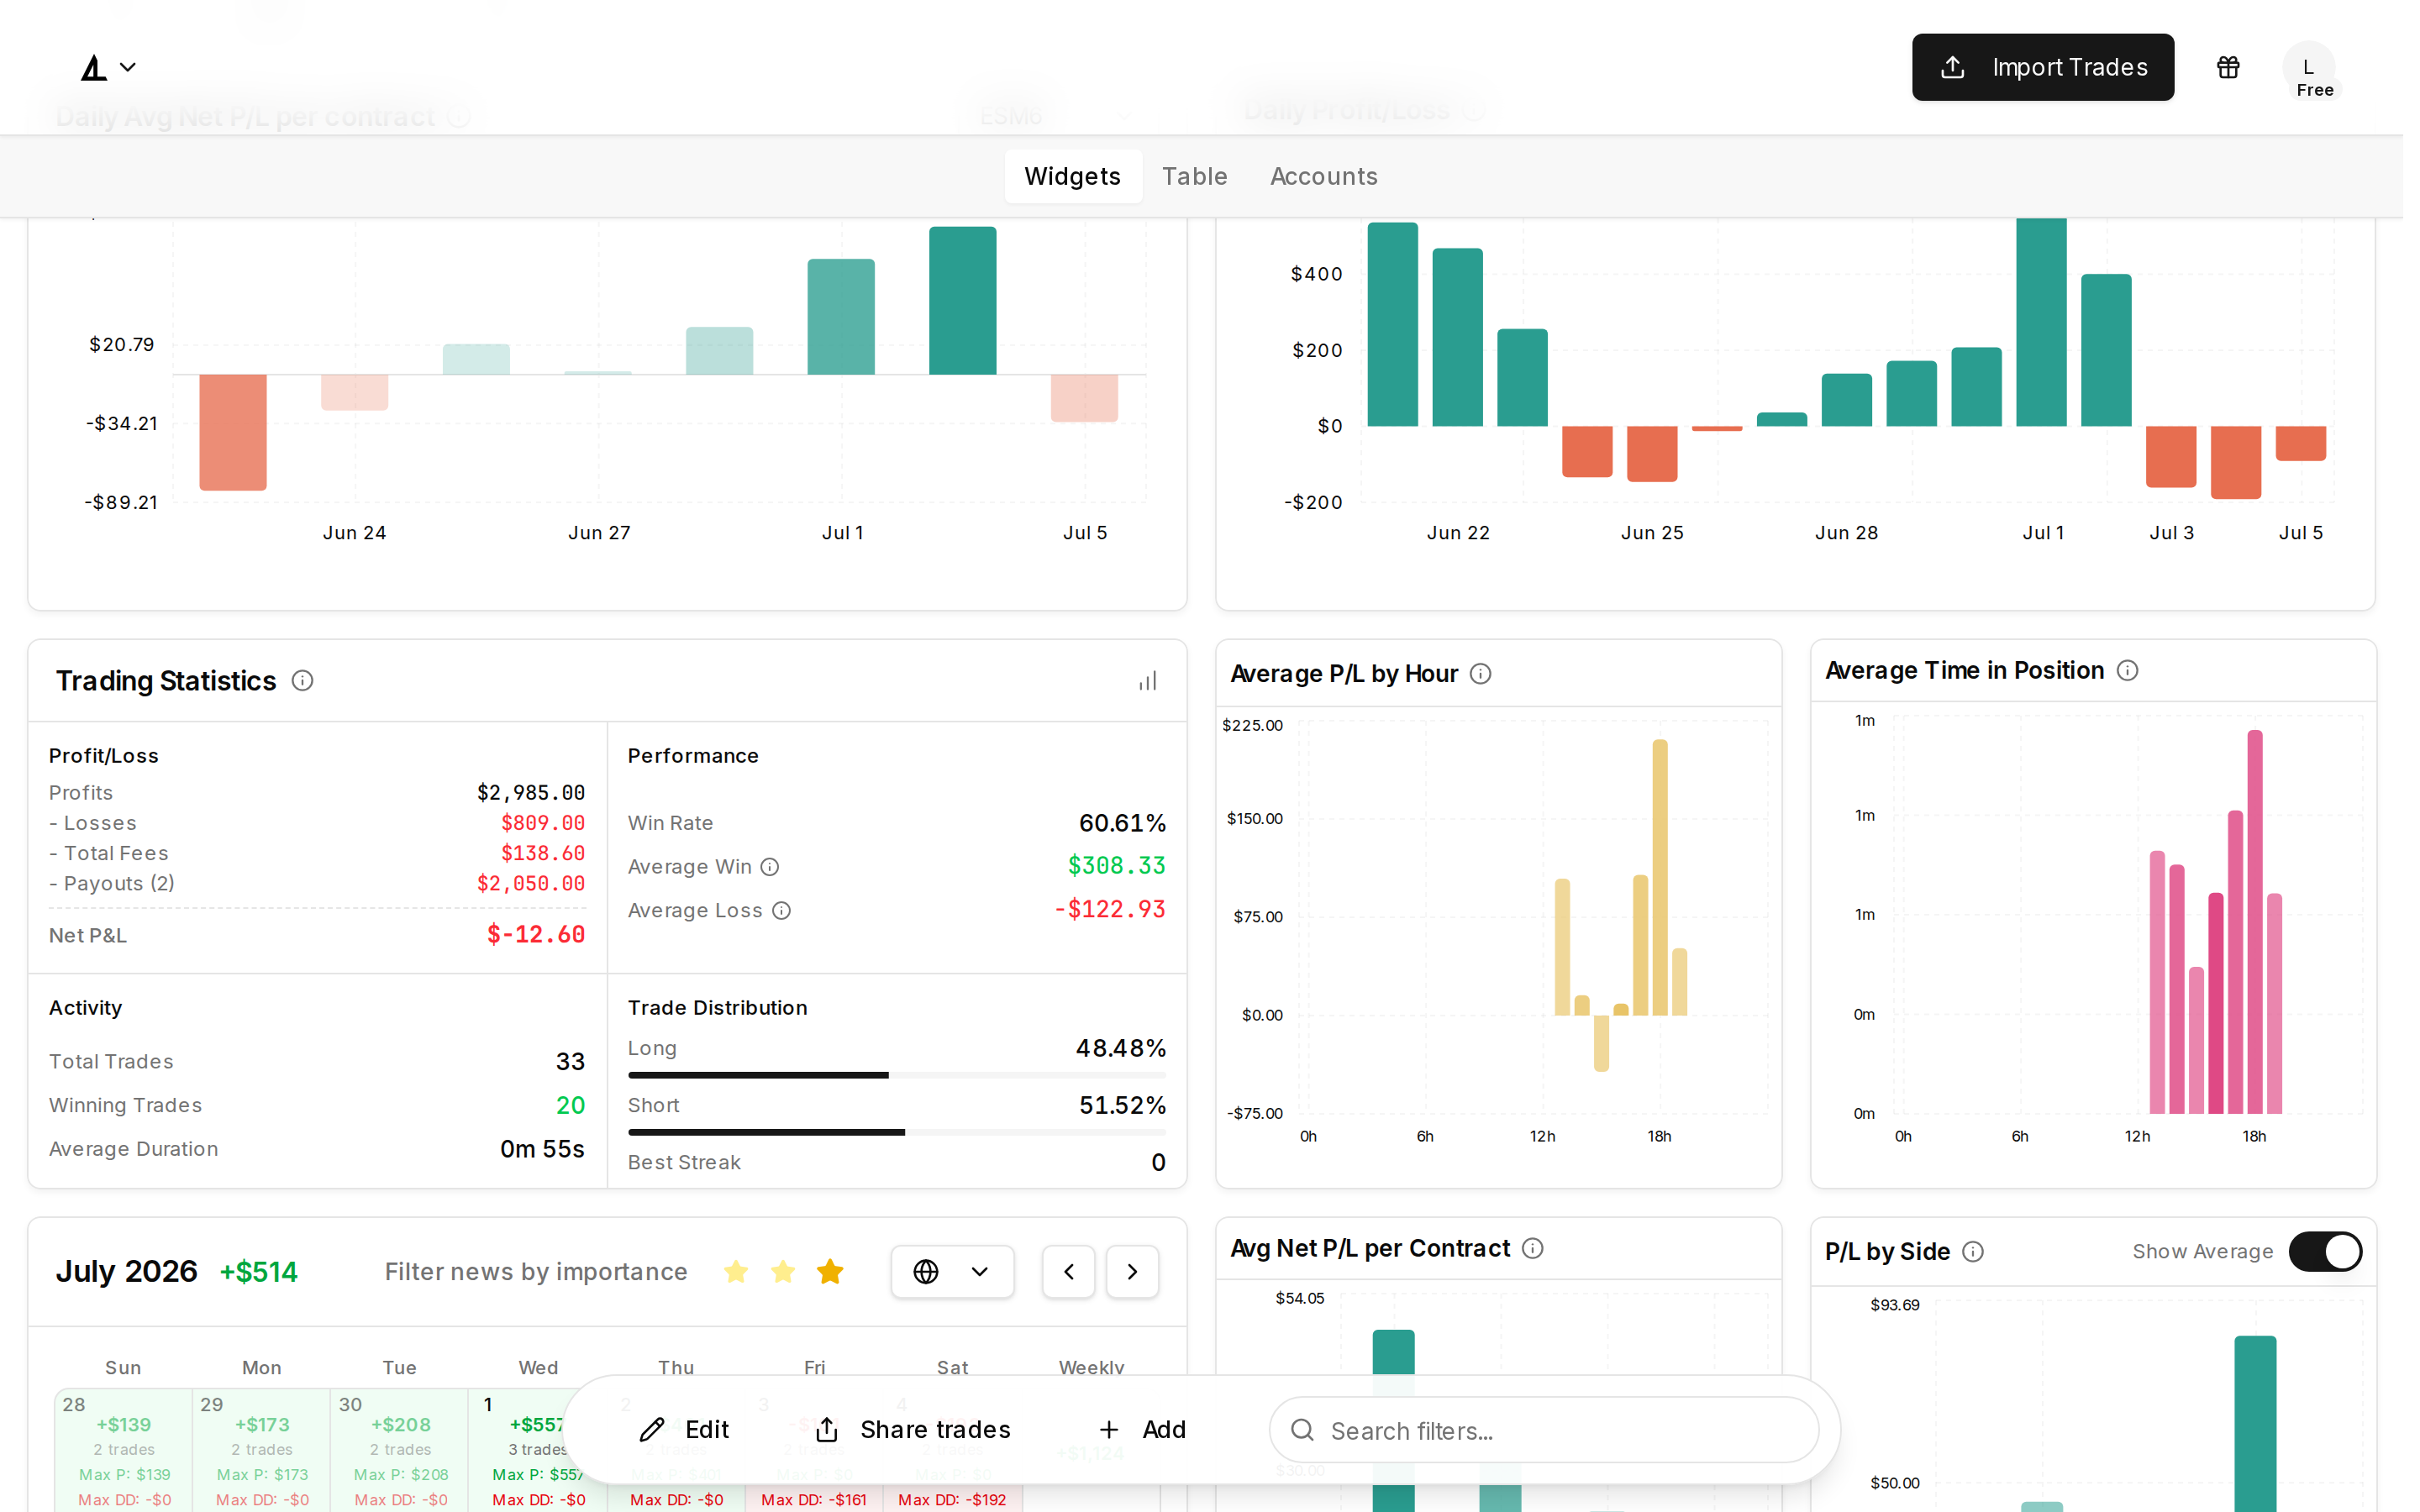
Dashboard charts—including bar charts, line charts, donuts, and the calendar analytics—now show a skeleton layout while data is loading. You see the shape of the chart (axes, grid, placeholder bars or lines) instead of an empty box or centered loading text.
The skeleton mirrors each chart's real layout, so there's less visual jump when data arrives. Calendar modals keep showing cached charts during a refresh and only skeleton the parts still fetching.