A rebuilt dashboard shell: connections, view menu, and filters
The chrome around the dashboard is rebuilt. The full-width Widgets / Table / Accounts tab strip that used to sit under the navbar is gone — the same three views now live in a compact view menu in the top bar, on a shorter navbar and a lighter canvas.
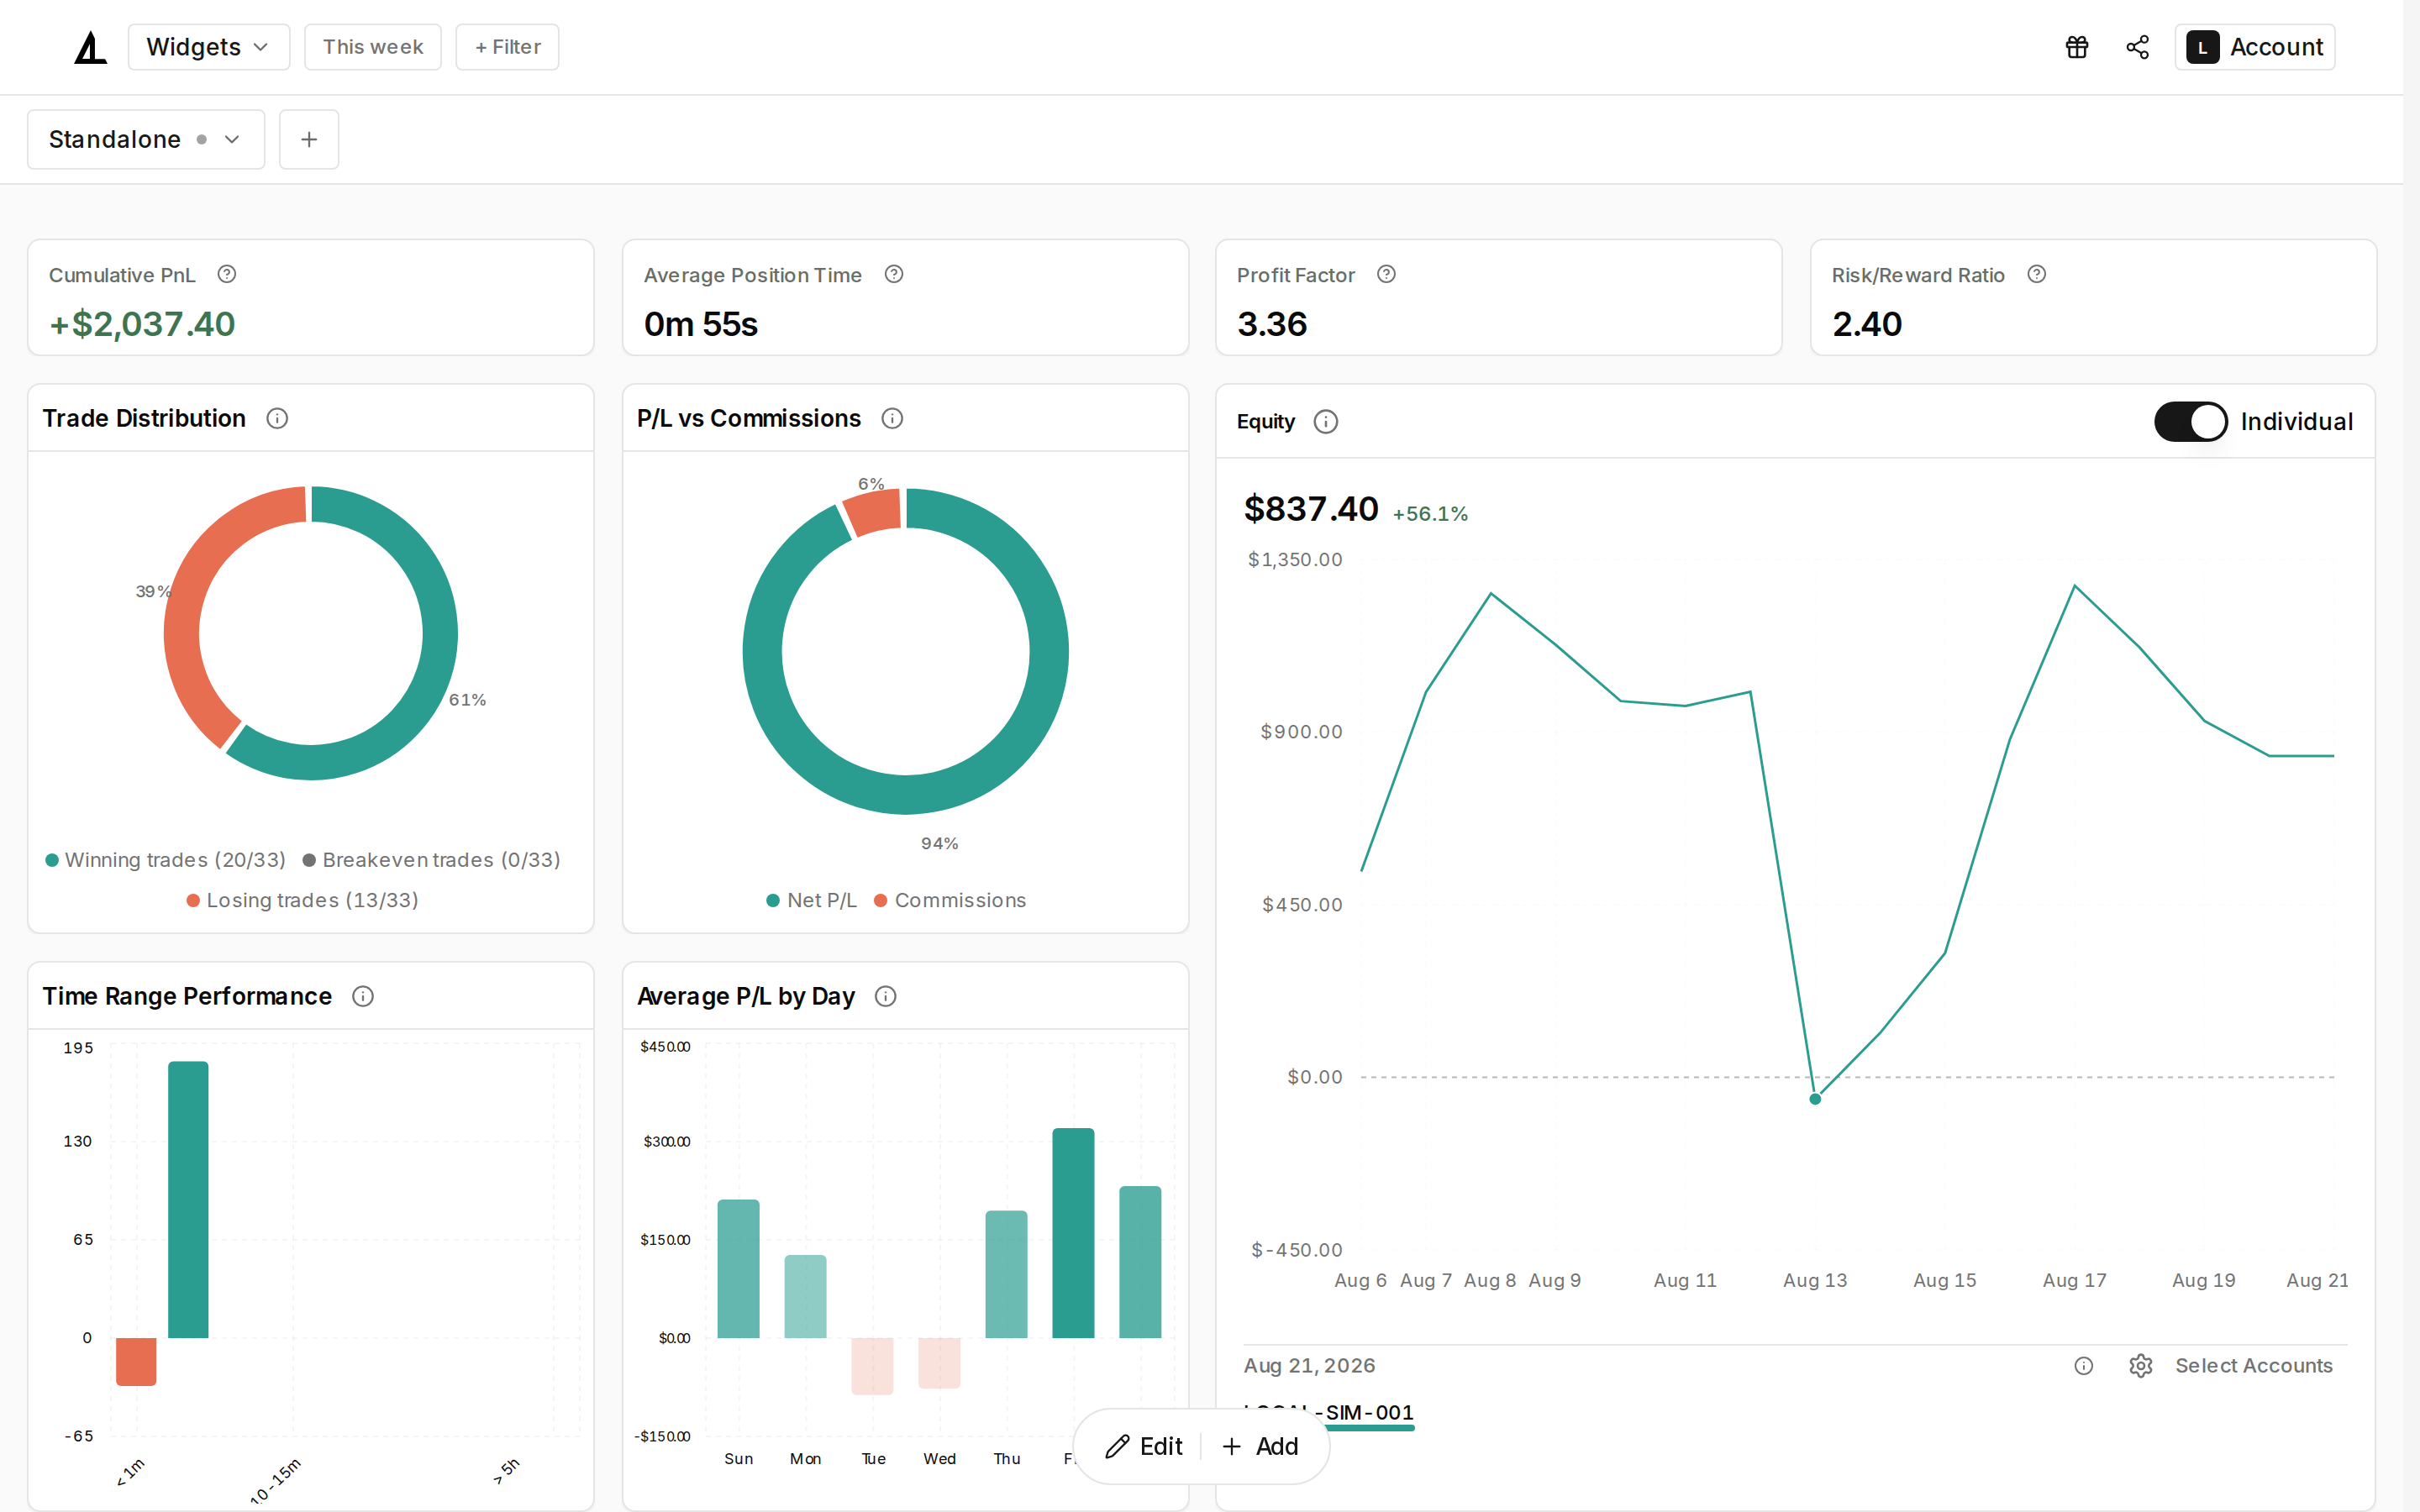
What's in the top bar now
The view menu switches between Widgets, Table, and Accounts. A Connections strip sits underneath it, showing your connections as chips with their display name rather than raw account numbers — select a chip's account in the picker to filter the dashboard to it, and toggle it again to clear the filter. Standalone accounts group under a Standalone chip with its own searchable picker, and each chip opens Manage connection for that provider. Status dots read Connected, Disconnected, or Offline.
Share and Account (which opens Billing, Connections, Data, and Settings) now live in the navbar itself.
Filters move to the top bar
A This week date chip and a + Filter control replace the old filter placement. On desktop, filters open in a right-hand sheet; on mobile, a filter icon opens a bottom drawer, and the mobile home view can show a second navbar row of active chips. Either way, active filters pin at the top with a Clear all action, and sections — Date Range, Accounts, Instruments, Tags, PnL — fold open one at a time, the same pattern as the account drawer. The date chip opens Date Range directly; + Filter opens the full, collapsed list.
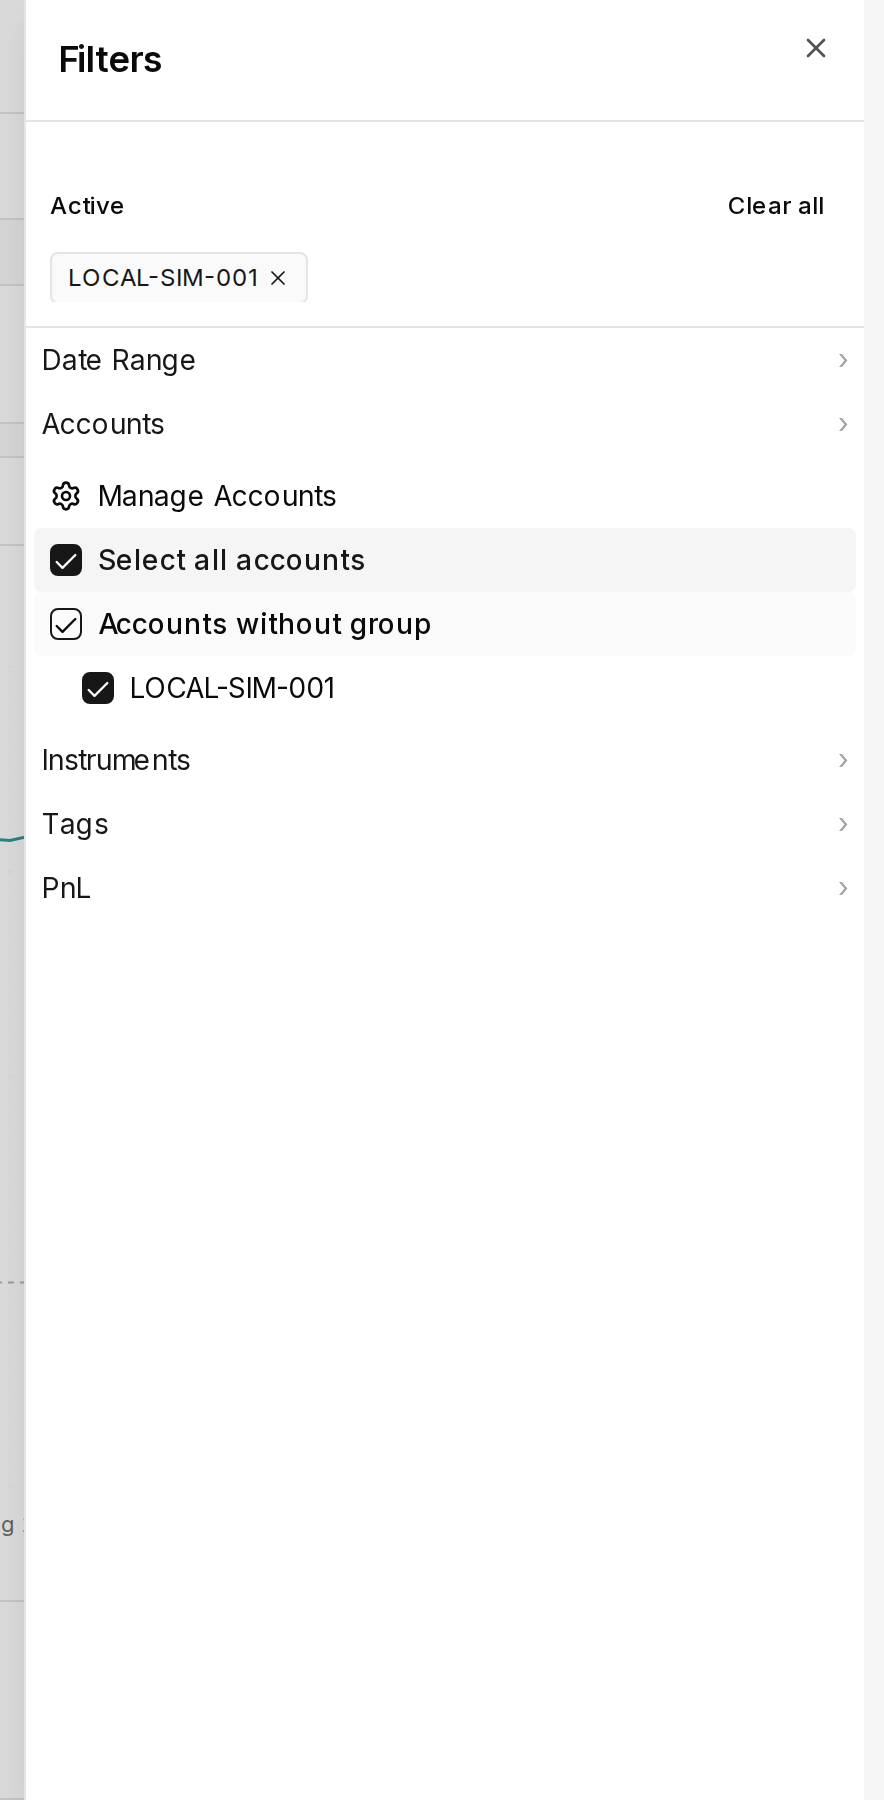
A layout-only toolbar pill
The floating bottom pill keeps Edit and Add, but it's layout-only now: it no longer duplicates the view switch. Opening Add filters the widget catalog to the current viewport, so widget types already placed on your desktop or mobile layout are hidden from that layout's list — if every type is already placed, the sheet says so instead of showing an empty grid.
Subpages and billing share the shell
Connections, Data, Settings, and Billing now share the same ← Dashboard | {Title} header on the light canvas, so navigating back never leaves the dashboard's visual language. The Billing page picks up the same restyle, with Current plan, Available plans, and Billing history sections on white cards (an empty invoice history now reads No invoices yet).
One honesty note: the navbar's Send feedback action is no longer part of this chrome.
Open the dashboard to try the new view menu, a connection chip, and + Filter, then use Account to reach Billing or Connections.