Landing page: swipeable dashboard chart previews
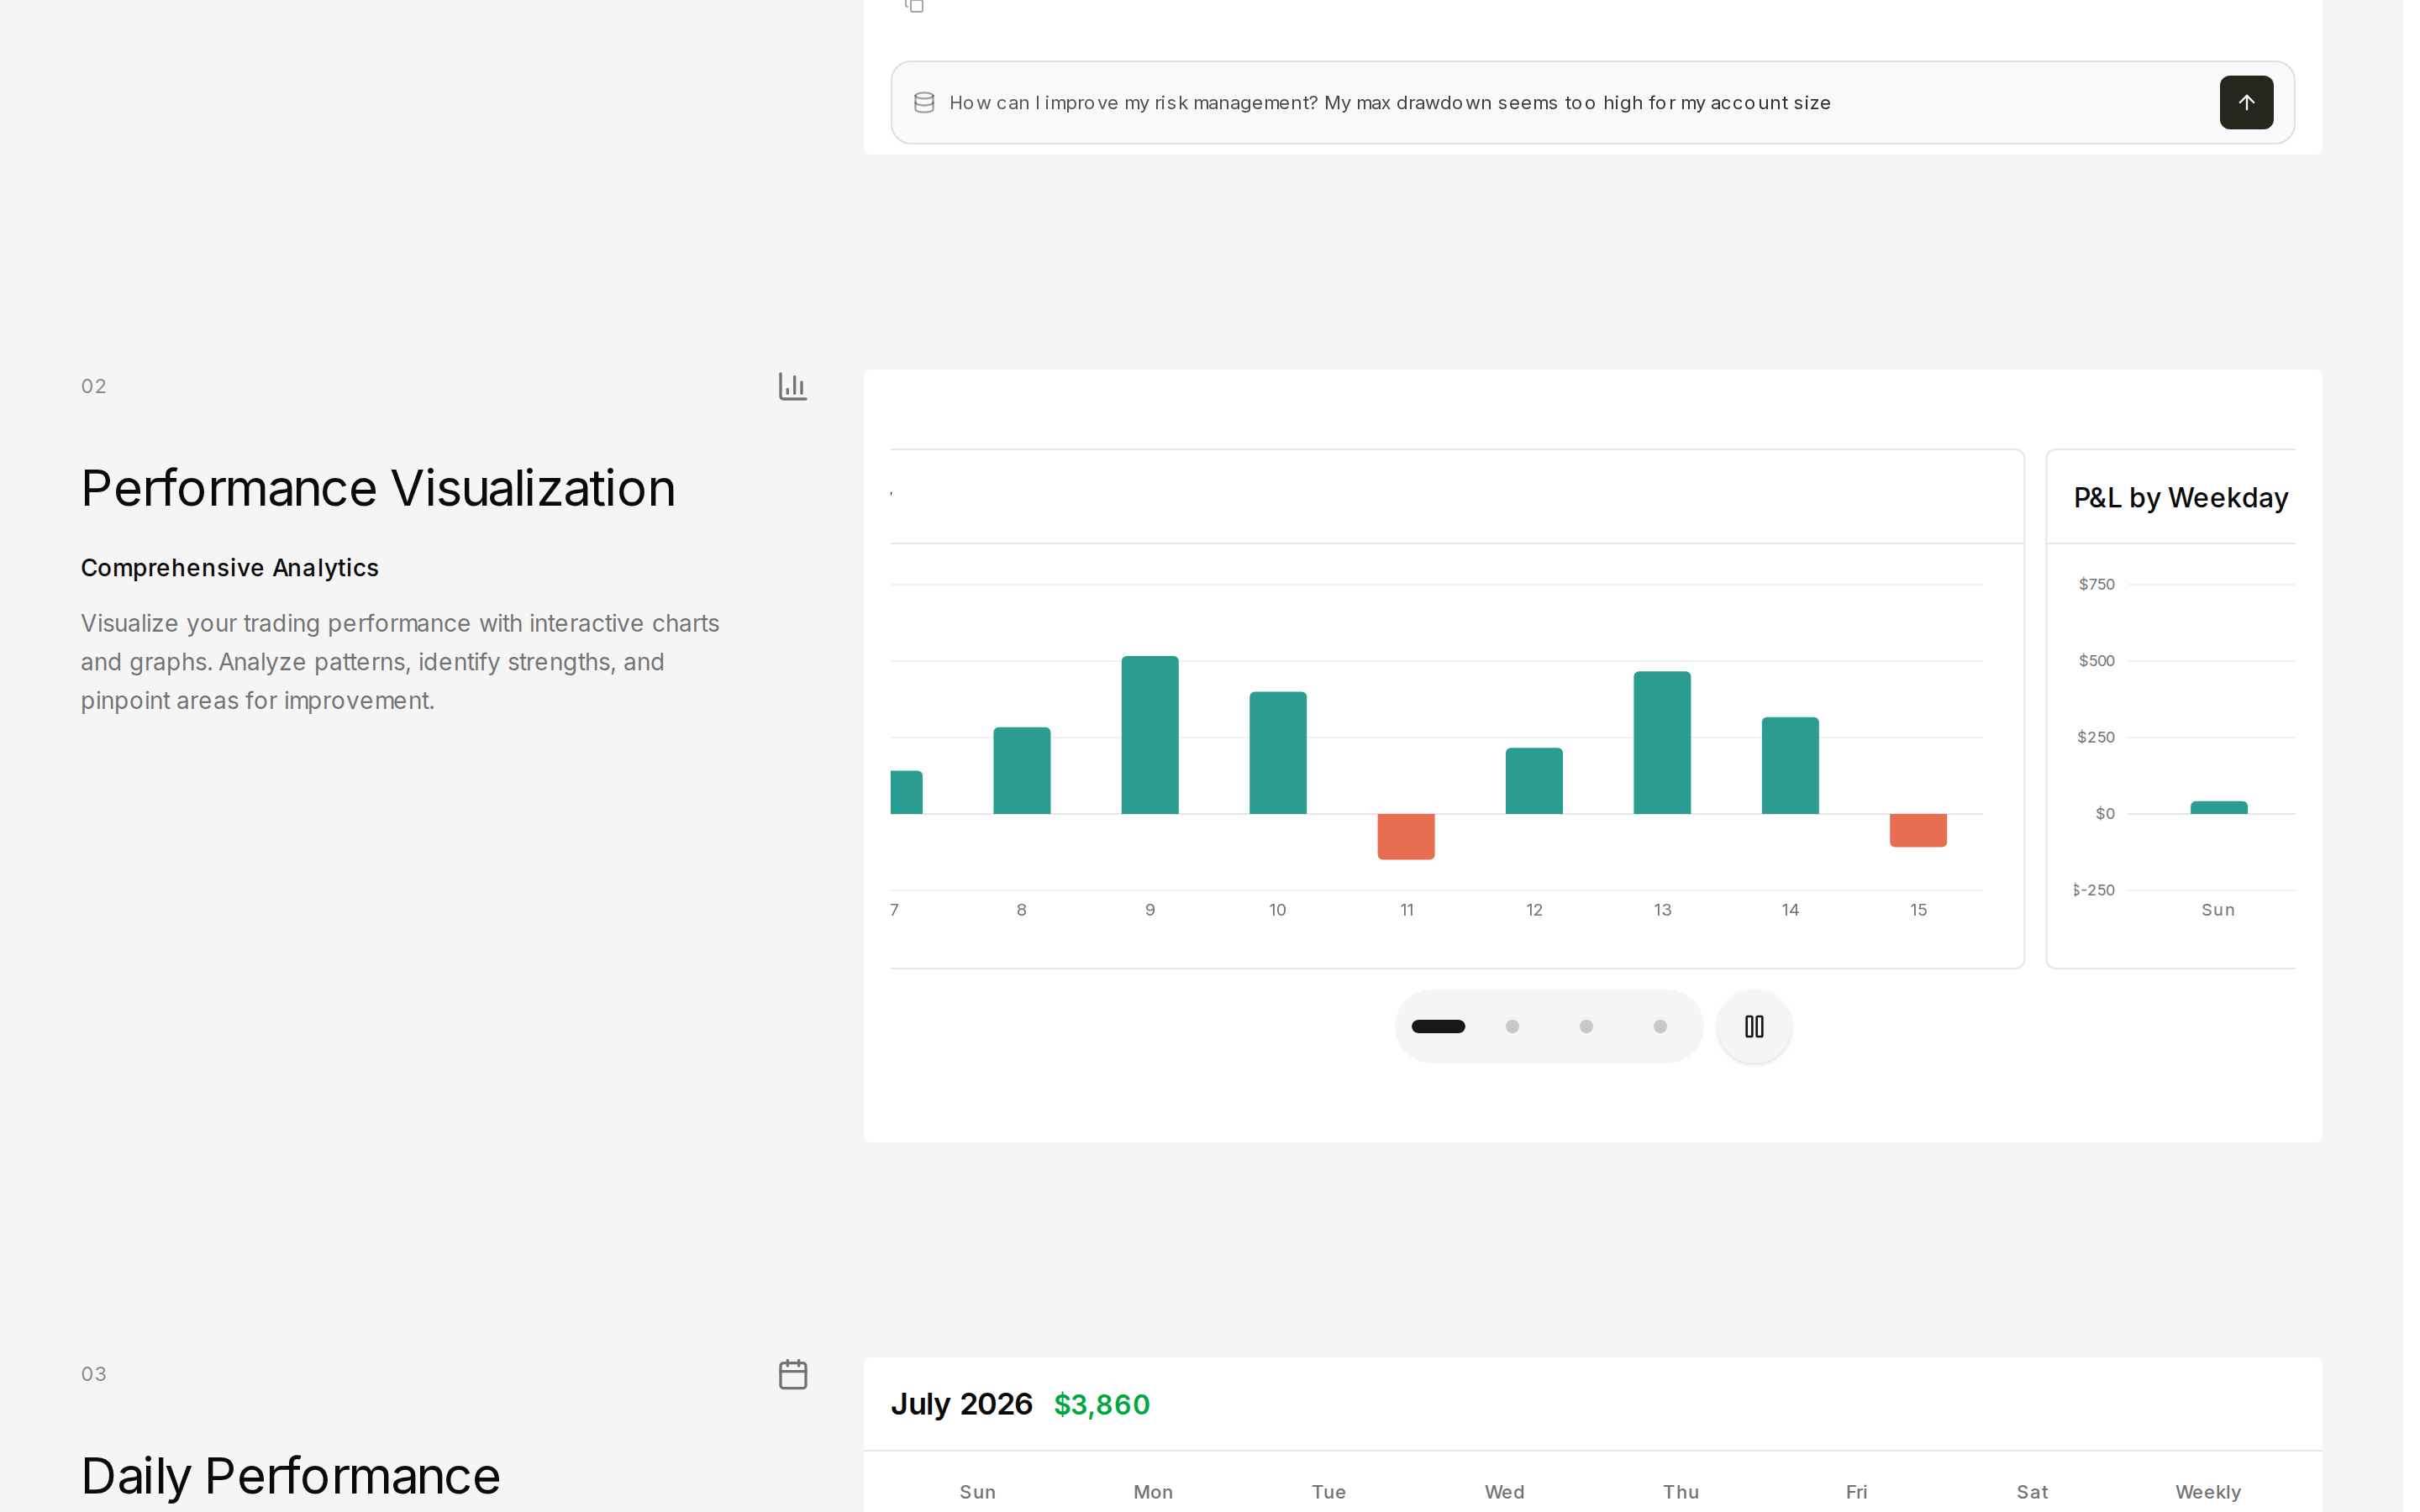
Two feature sections on the homepage now show rotating chart galleries that mirror what you see in the dashboard. Performance Visualization and Track Your Performance cycle through equity curves, daily P&L, weekday and hourly breakdowns, trade distribution, and daily tick targets.
The carousel auto-advances with animated dot progress, pauses when you interact or when reduced motion is preferred, and supports swipe navigation on mobile. Tap a dot to jump straight to a specific chart.