Landing page: weekly repo activity graph
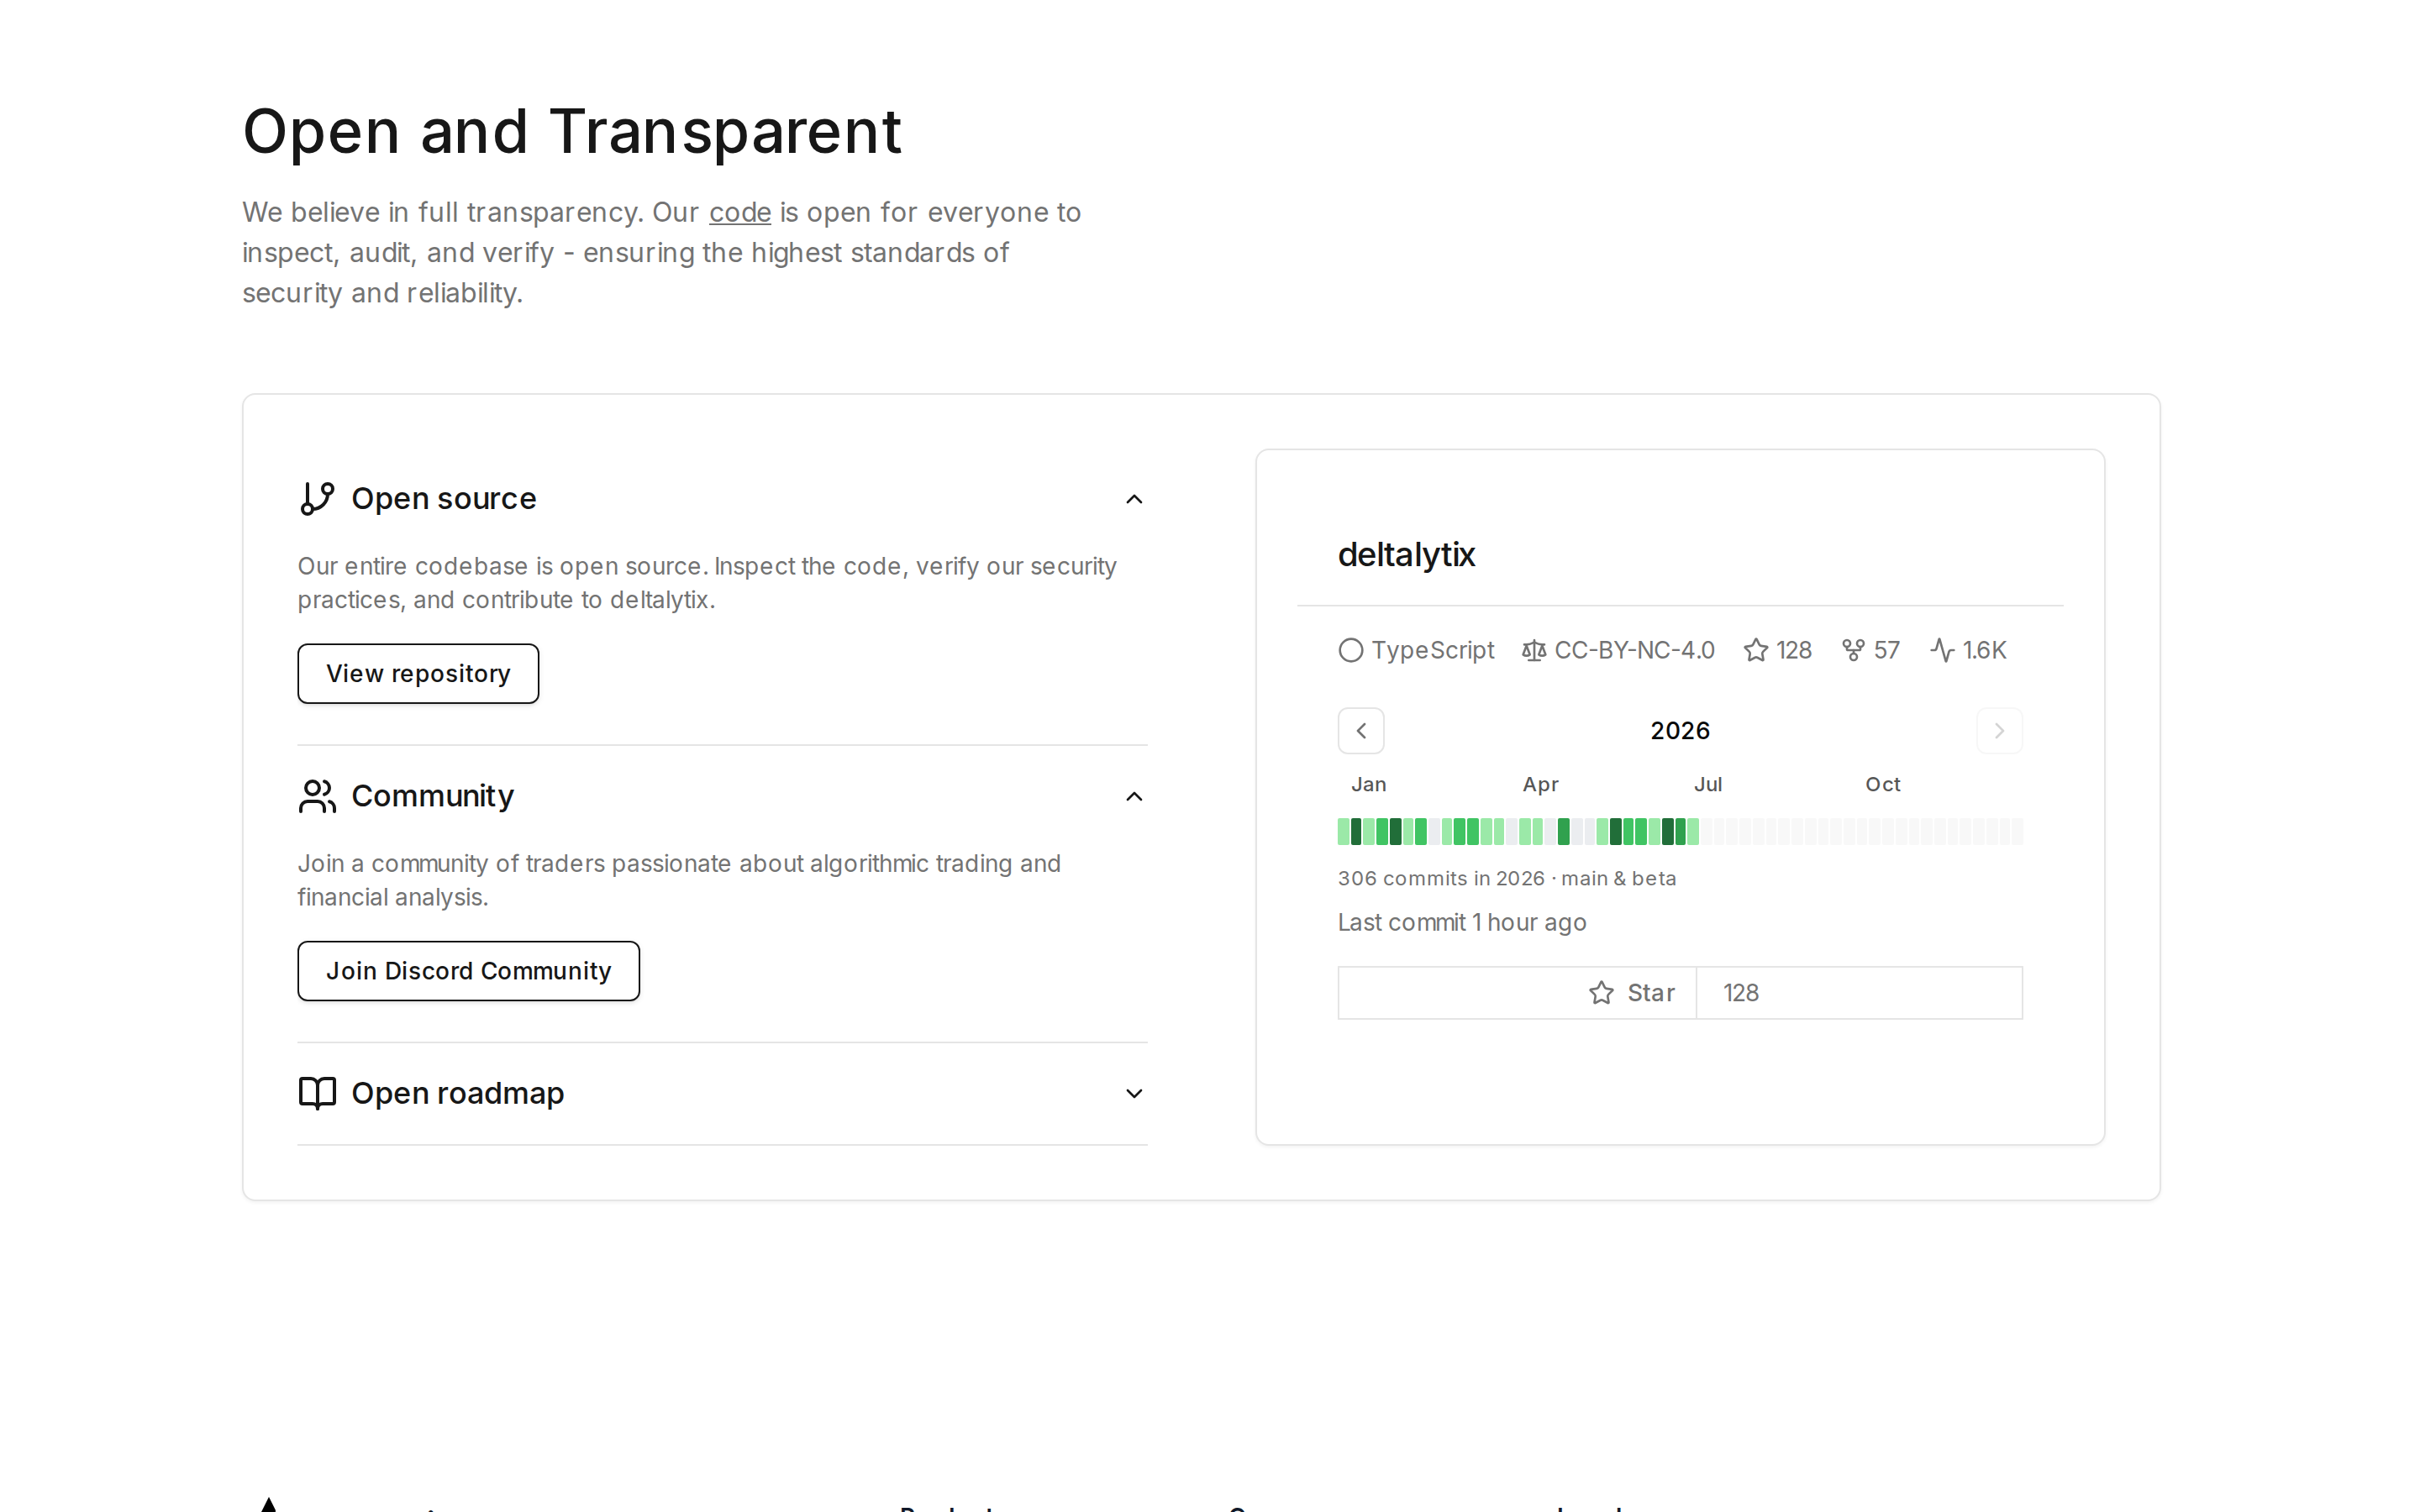
The Open and Transparent section on the landing page now includes a GitHub-style activity graph for the public repository—redesigned as a weekly view instead of a daily heatmap or line chart.
What changed
- One bar per week across the full calendar year, with no horizontal scrolling on mobile
- Quarter month labels (Jan, Apr, Jul, Oct) that stay readable on small screens
- Muted gray bars for upcoming weeks so you can see the rest of the year at a glance
- Year navigation to browse activity from the repo’s first year through today
- Tap any week to open a detail panel with active days and contributors
- main & beta only — commits are deduplicated by SHA across both integration branches
Activity data is cached weekly to keep the landing page fast while staying reasonably up to date.